Project Gantt
The Gantt chart represents the core of the project management system. This intuitive interface allows you to plan, monitor, and analyze the timeline of a project in a clear and interactive way.
Activities are divided into milestones and phases, with the option to customize the time unit — days, weeks, fortnights, months, two-month periods, quarters, semesters, or years — to fit any type of project.
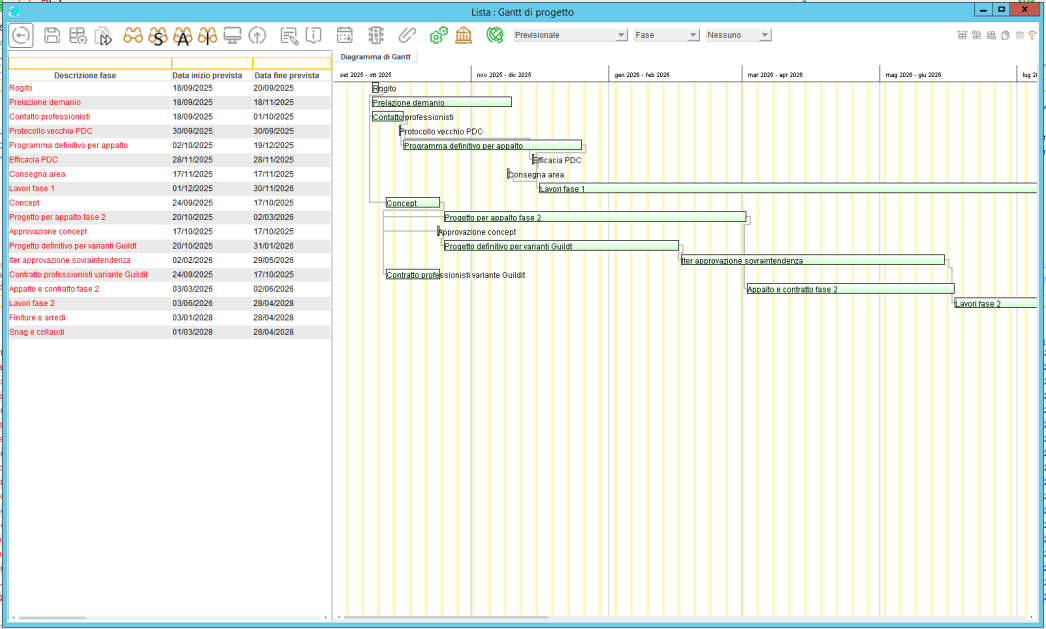
Date View
Each activity is represented by a horizontal bar showing its duration and dependencies.
You can switch between two display modes:
- Planned dates: the project’s initial scheduling.
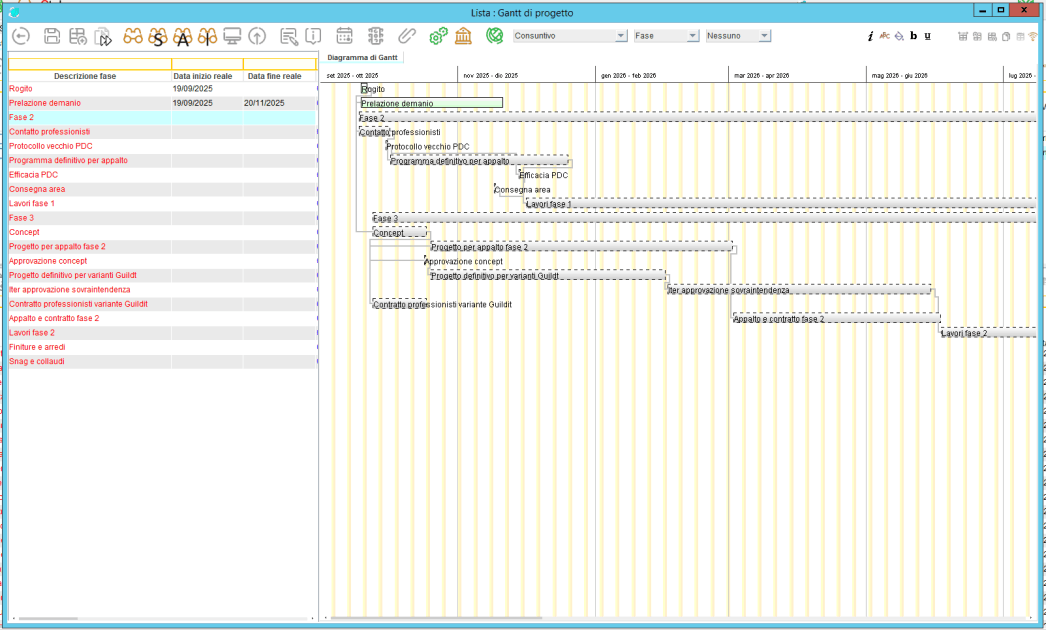
- Actual dates: the real execution of activities (if no real data is available, the phase appears in gray).
The system also allows you to compare planned and actual dates, automatically highlighting any time deviations.
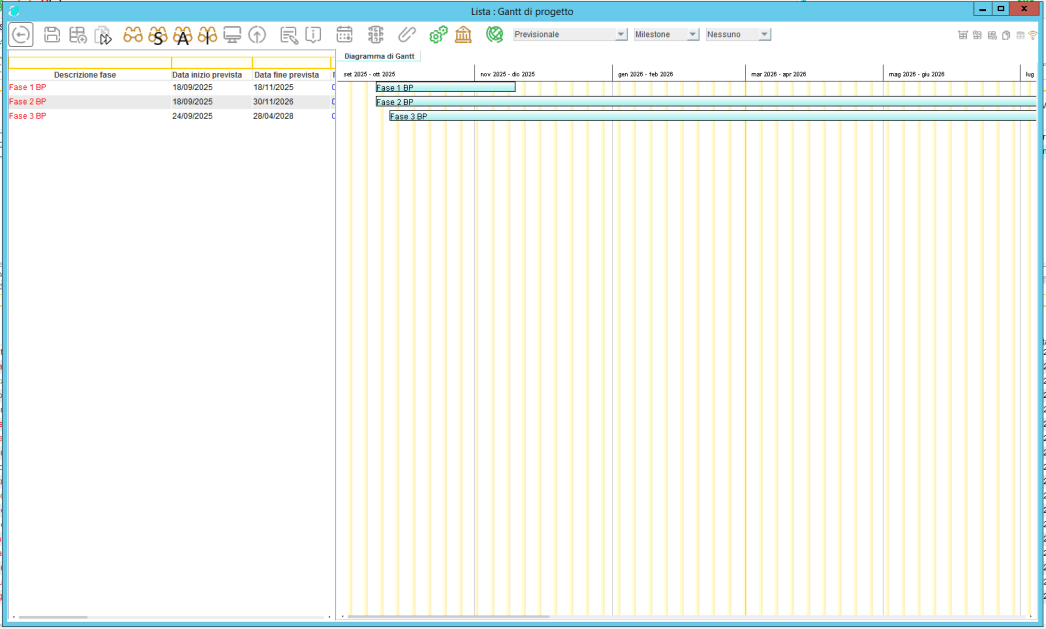
Milestone and Phase Management
Milestones mark the key points of the project, making progress tracking easier.
Phases are organized hierarchically and can be divided by area (e.g., purchasing, sales, management). Each phase can be monitored individually, with clear indicators of progress and performance.
Work Progress and Cost Control
The interface displays real-time progress through intuitive progress bars. It also shows cost tracking:
- If actual costs exceed planned costs, the phase is highlighted in red, immediately signaling a budget overrun.

Road G. A. Longhin 103
CAP 35100
Padova, Italy
Email: info@stingsrl.com
Telephone: +39 049/8072862

Free AI Website Creator